push-lab
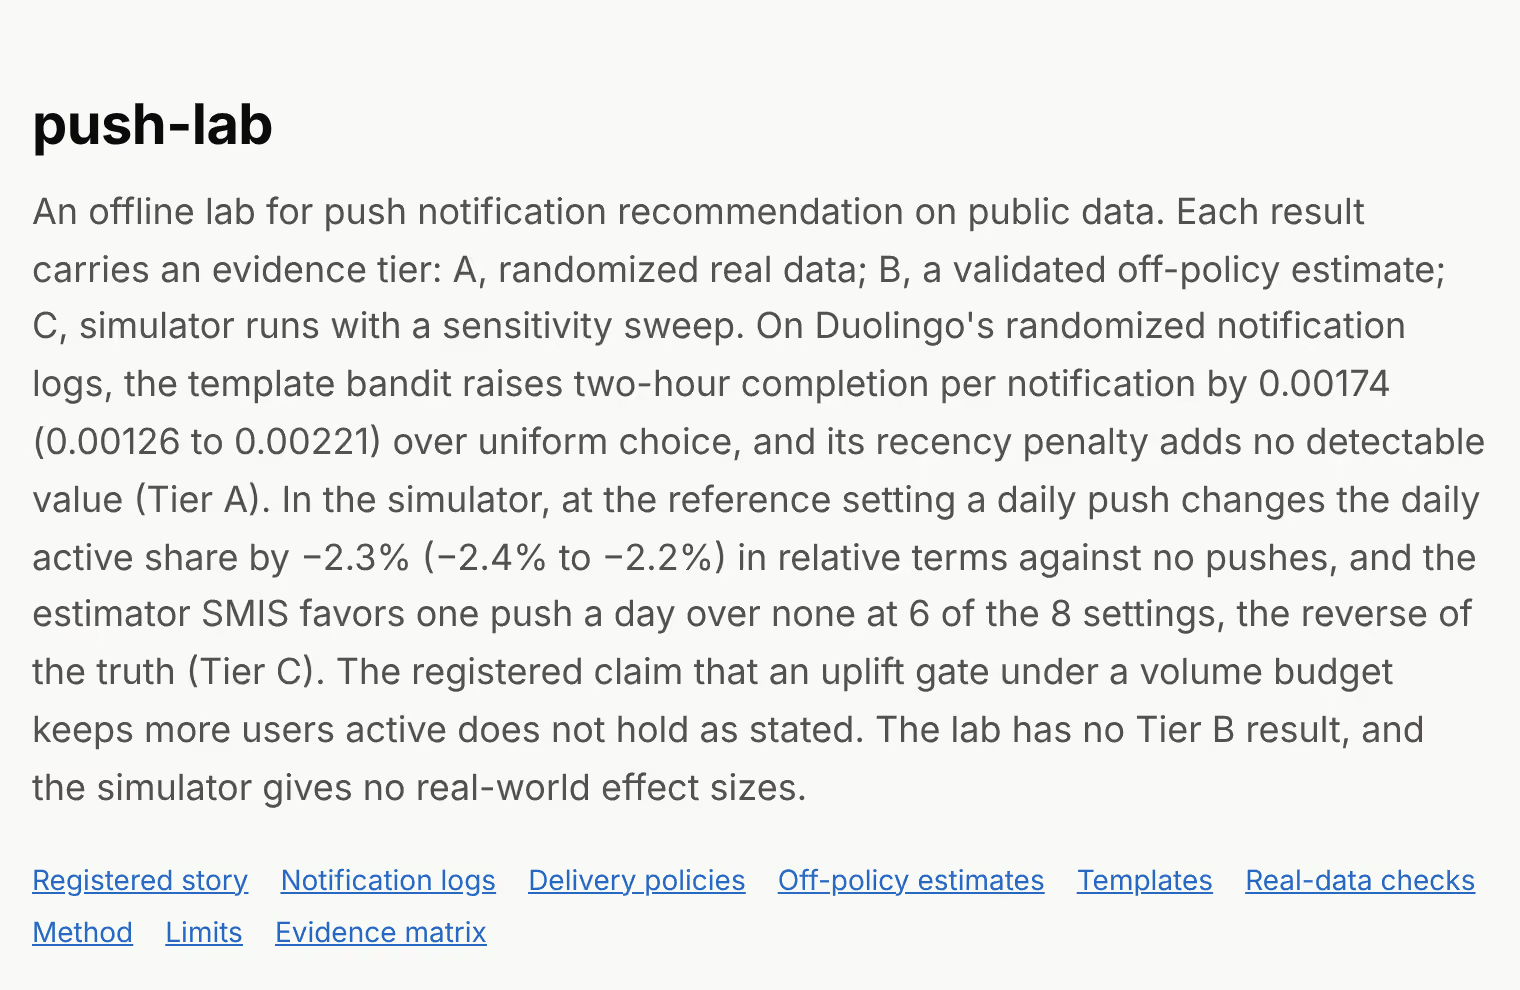
An offline lab for push notification recommendation on public data, from recall and ranking to send volume and timing, with every result labelled by how far it can be trusted without live traffic. On Duolingo's randomized notification logs, the template bandit beats uniform choice by 0.00174 (0.00126 to 0.00221) in two-hour completion per notification (Tier A).
Key metrics
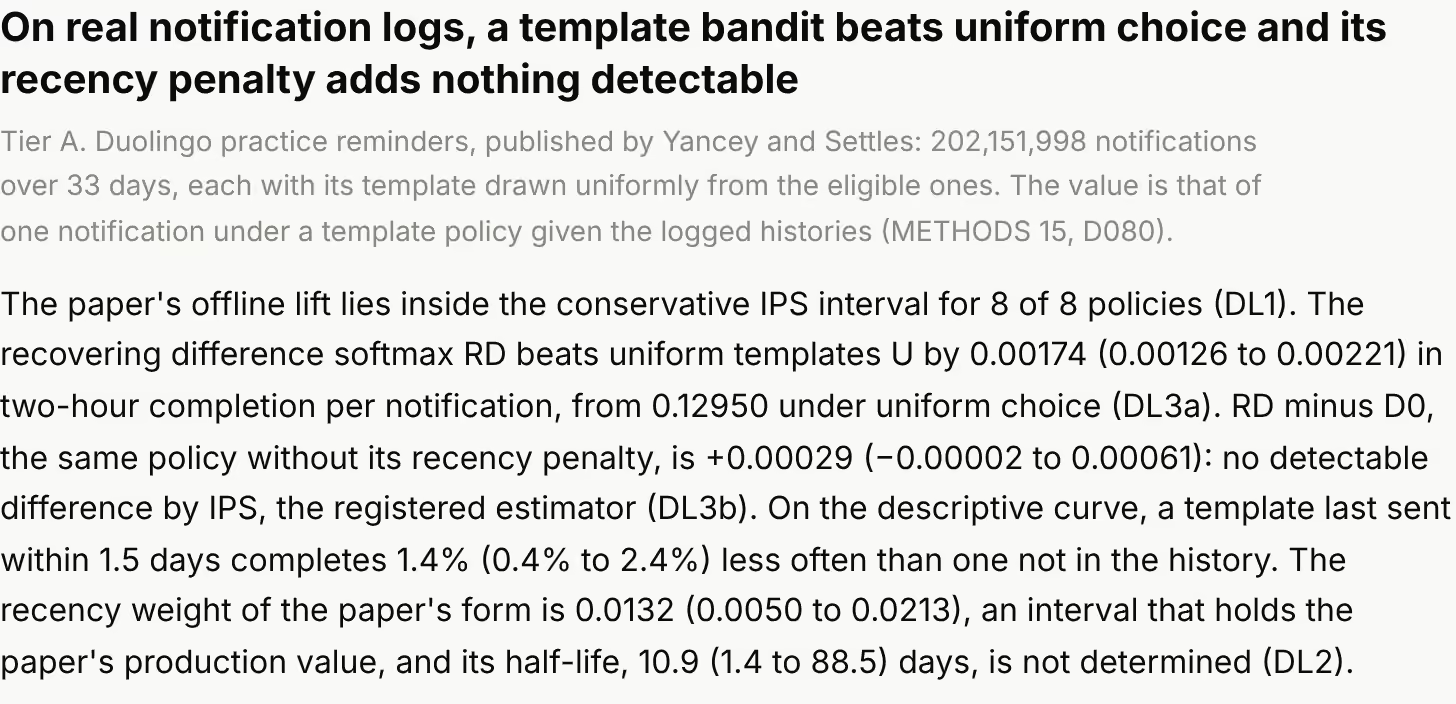
- gain in two-hour completion per notification of the template bandit over uniform choice, on Duolingo's randomized logs (0.00126 to 0.00221, conservative across days); its recency penalty adds nothing detectable, +0.00029 (−0.00002 to 0.00061)
- +0.00174
- of the known click rate, as estimated by IPS on the full Open Bandit campaign. The registered interval over impressions, 0.815 to 0.966, excludes it and no estimator passed; post hoc, over ten-minute blocks the interval is 0.789 to 1.004
- 0.891
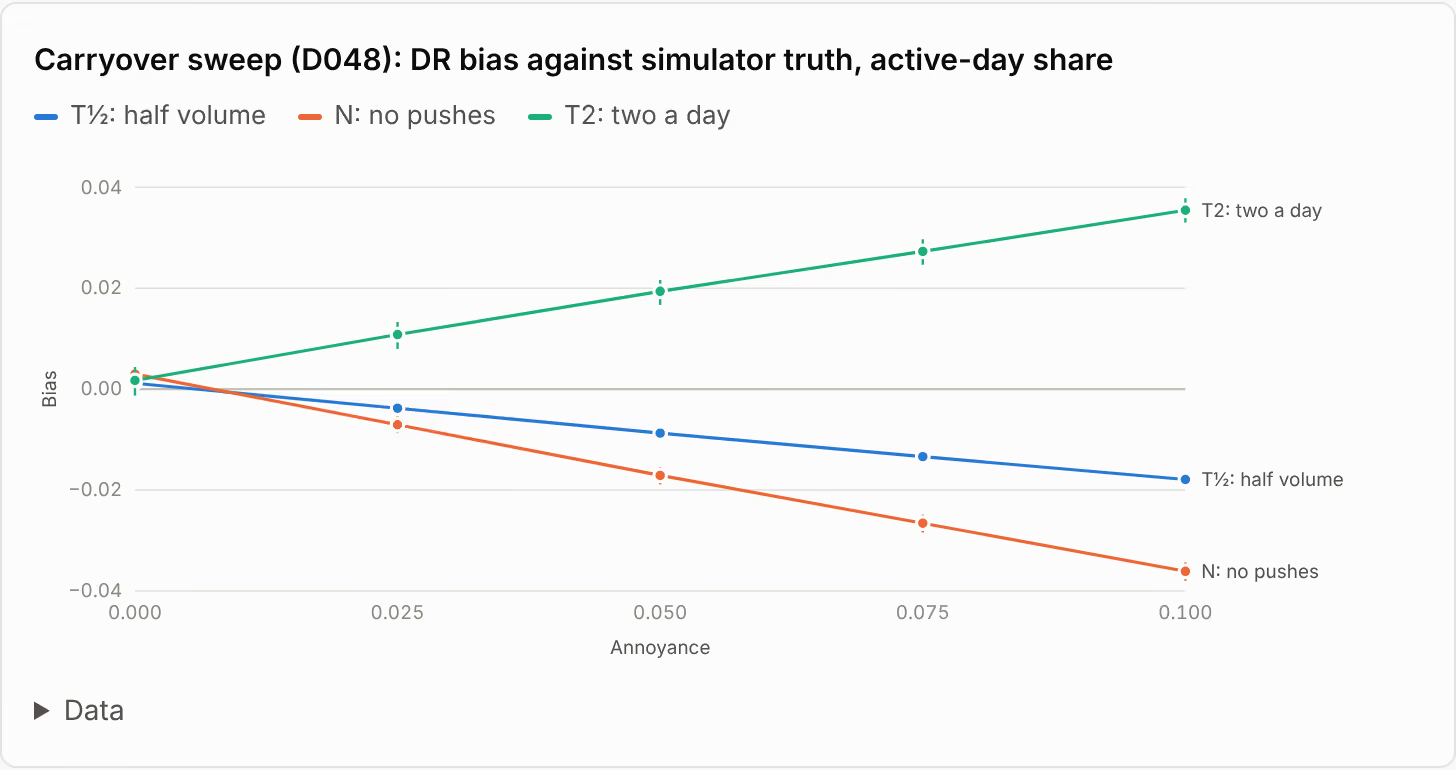
- daily active share from one push a day against none, at the simulator's reference setting (−2.4% to −2.2%)
- −2.3%
- settings in which a gate at half the volume beats a daily push; it loses in 19, and wins in none once annoyance is removed
- 43 of 64
The first two figures are Tier A, on randomized real data: the first scores a policy for one notification given the logged histories, the second measures the estimators. The other two are Tier C and hold only in the simulator, read across a sweep of its assumptions. Brackets give 95% intervals, and per-setting verdicts rest on one model fit. In a registered long-horizon study, with one simulated world and 5,000 users, the estimator SMIS, on the project's exploration logs, favours one push a day over none at 6 of 8 settings, the reverse of the truth (Tier C); the study reads its primary labels at the reference only. The ten-minute-block interval of IPS is 0.789 to 1.004 here and 0.790 to 1.005 on the ope-checks page: the two projects ran it separately, and their point estimates differ too (0.8909 and 0.8913). Results summary
Problem and goals
push-lab builds the whole pipeline of a push notification recommender on public data and four CPU cores: two-tower recall with an approximate nearest-neighbour index, a coarse and a fine ranking stage, uplift models, and a delivery policy that decides whether to send, in which slot of the day and with which copy. A static report and a notebook present the results.
Its story was registered as a hypothesis before the simulations ran: sending the top item to everyone every day wins on clicks in week one but loses users to fatigue and opt-outs by week four, while a policy that sends only when the predicted uplift is high enough, under a volume budget, keeps more users active. Every comparison was fixed in advance and reported as it came out, including the parts of the story that did not hold.
The end-to-end story is a simulation built on video feed data, and the uplift trials are e-mail and ads, and Duolingo's logs randomize only each notification's template. Each result is therefore labelled Tier A when it rests on randomized real data, Tier B when it is an off-policy estimate from an estimator validated against a known answer, and Tier C when it comes from the simulator with a sensitivity sweep.
Architecture
Public datasets are downloaded with pinned checksums and converted to Parquet; raw data is never committed. Two-tower recall with a faiss index builds the candidate pool on KuaiRand, the two-tower score keeps the top N, and a LightGBM ranker picks the one item a push would carry. The delivery policy decides whether to send it, in which slot of the day and with which copy, under a volume budget, and it is run in a push simulator whose response model is fitted on KuaiRand's random exposures and whose assumptions are swept. The simulator's exploration logs fit the policy's uplift gate and feed the off-policy estimators, which are also checked on the Open Bandit Dataset. Uplift methods are tested on the randomized Hillstrom and Criteo trials, and the template policy is scored offline on Duolingo's randomized notification logs. Every stage writes its results to JSON, and the report, which reads only those files, labels every number with its tier.
Key decisions
-
D002 Offline only, with evidence tiers
There is no live traffic, so every result carries one of three tiers: A for randomized real data, B for an off-policy estimate from an estimator first checked against a known answer, C for simulator runs shown with their sensitivity sweep. Published notification systems report small online effects, about 0.1% to 0.5% of daily active users, and their offline estimates agree least with online results on the longest-horizon metric, so no simulated effect size is presented as a real one.
-
D009 Volume control is separate from ranking
Following Zhao et al. (2018), the ranker picks what to send and the policy decides whether to send it, so changing one does not confound the evaluation of the other. The uplift gate's threshold and the budget's Lagrange multiplier are the same dual variable. A single multiplier is optimal only when each extra send gains less than the one before, which fatigue can break, so a test compares the allocation with brute force on small instances and documents a case where the condition fails.
-
D013 The uplift gate is learned inside the simulator
Models trained on Hillstrom or Criteo cannot score KuaiRand users, whose features and treatments differ. The simulator therefore runs an epsilon-greedy exploration policy over sending or skipping, the slot and the template, and the gate is fitted on those logs, which also give the off-policy estimators overlap with every target policy. The uplift results on the real trials validate the methods and are Tier A; the gate's results are Tier C.
-
D014 The send-time policy does not read the simulator's profile
If one activity profile drove both the send-time policy and the simulator, the policy would win by construction. The simulator uses each user's activity from 22 April to 8 May, the policy estimates its own profile from 9 to 21 April, and the sweep adds a shift and noise on top.
-
D049 Report and README are generated from the results
The report build reads only
results/*.jsonand writes the static report and the numbers in the README, which sit between generated markers. Every number goes through one lookup by file and key path and one formatter, and a test checks that the prose templates hold no digits; CI fails when the README differs from what the results give. The report uses the standard library only, with inline SVG charts and no scripts, and is published only after CI passes on the same commit.
Challenges
-
A fine ranker that ranked worse
The pre-registered check expected the LightGBM fine ranker to beat the two-tower score it refines; on KuaiRand's random exposures its click GAUC was 0.545 against 0.598. Training and evaluation used the same columns, types and feature order, and the ranker did win on its own validation rows, so the reversal comes with the move from the production recommender's impressions to random exposures. The smoothed click rates it leans on were learned on impressions with a 53% click rate, against 17.7% on random exposures, and carry little signal there, while plain exposure counts carry more. The hyperparameters stay as registered, and any change to the ranker is reported as a separate variant.
-
A check that passed on too little data
Tier B needed an estimator that recovers a known policy value on real logs. On the small Open Bandit sample, with 46 clicks in the random logs, IPS and DR passed the registered rule. The full Men's campaign has 50 times the clicks, and there no estimator passes: IPS estimates 0.891 of the known click rate and DR 0.897, with registered intervals over impressions that exclude it, so the project has no Tier B result. The deployed policy was not the fixed prior the target assumes; re-weighting to its logged frequencies moves IPS to 0.917, a change of +0.026 whose interval (−0.004 to 0.059) includes zero, so these data do not show where the gap comes from. Along the way the bootstrap was moved from rows to impressions, since each impression fills three rows. Impressions are not independent in these logs either: post hoc, with ten-minute blocks as resampling units, the intervals of IPS (0.789 to 1.004) and DR (0.796 to 1.006) contain the known value, and that of the change is −0.021 to 0.074. The registered verdict stands, and no estimator is treated as validated.
-
Random streams that coincided
NumPy's seed sequence ignores trailing zeros, so
default_rng([s, 0, 0])gives the same numbers asdefault_rng(s). The exploration policy keyed its coins by seed, day and slot, so on the first slot of the first day they were the simulator's own open draws whenever the two seeds matched, which raised that slot's open rate from 0.13 to 0.38 in a synthetic run. Every keyed stream now starts with its purpose and ends with a 1, a test checks that the streams of one seed are uncorrelated, and rerunning the simulator build reproduced its committed inputs bit for bit.