backtest-lab
A backtesting platform that tests whether a strategy is probably overfit: it runs a parameter search, then judges the winner with walk-forward analysis, purged cross-validation, the probability of backtest overfitting and the deflated Sharpe ratio.
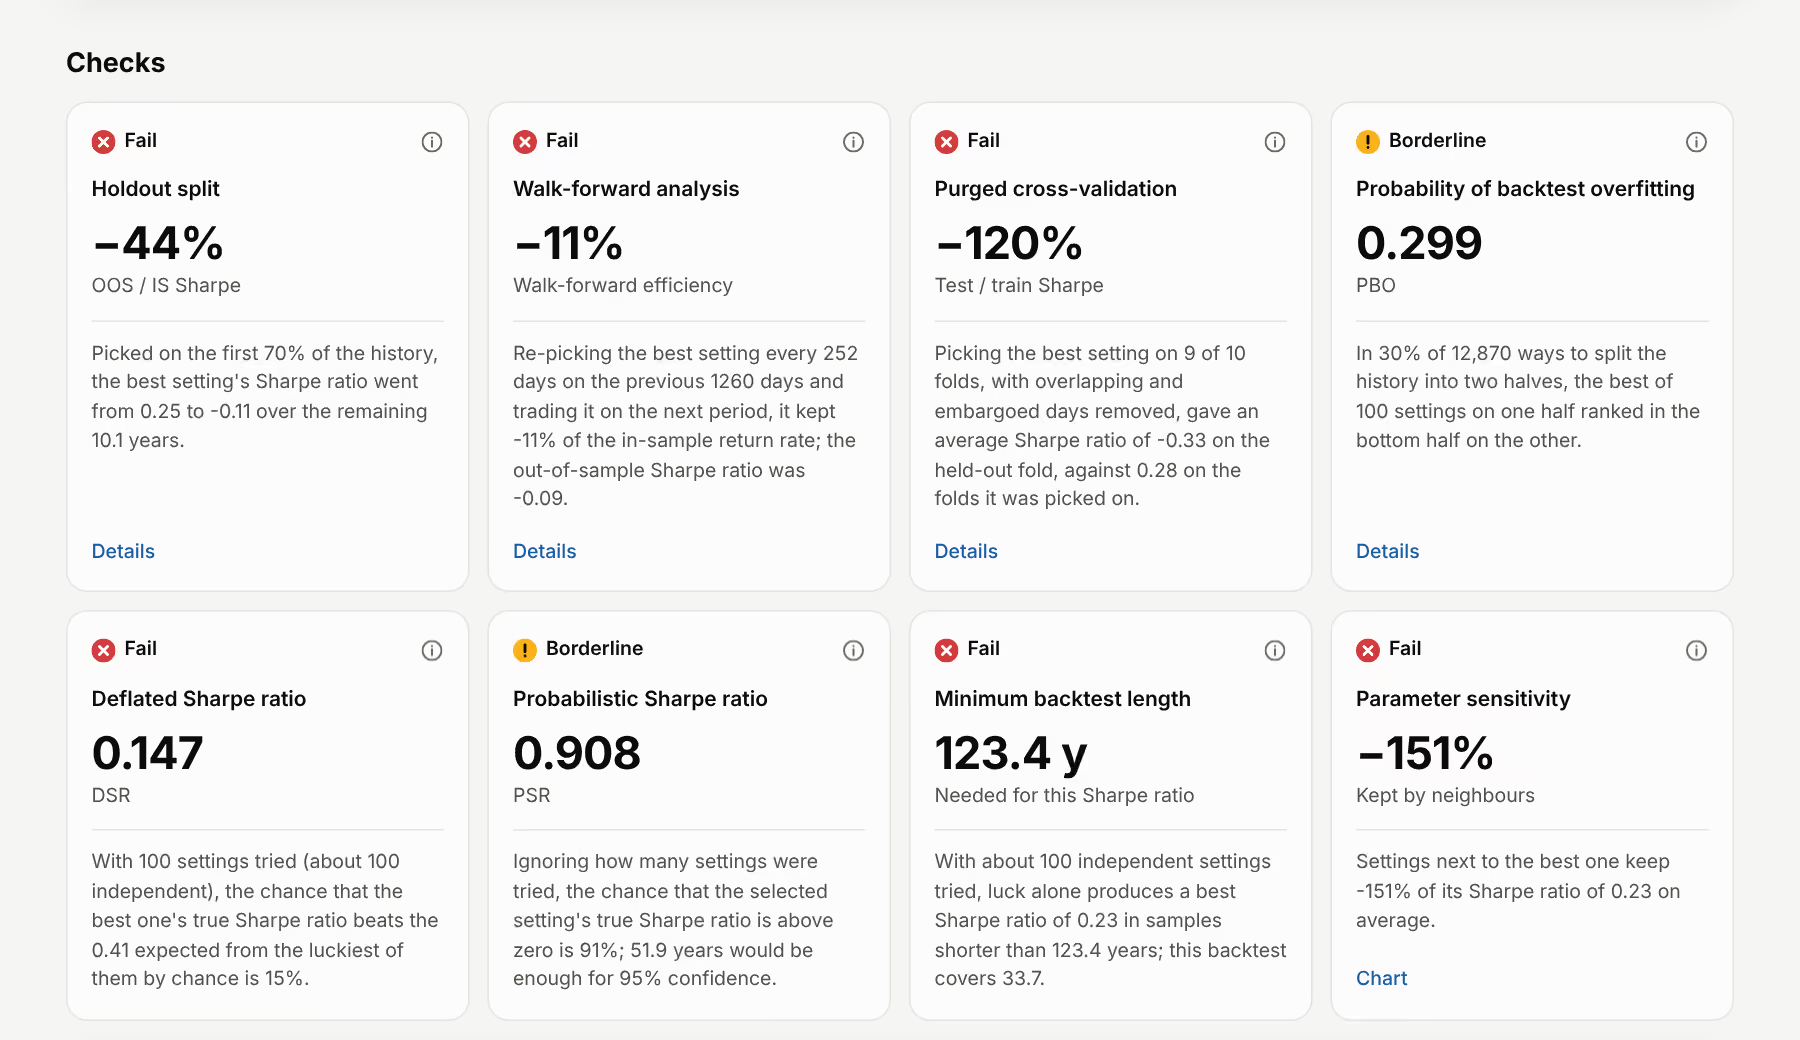
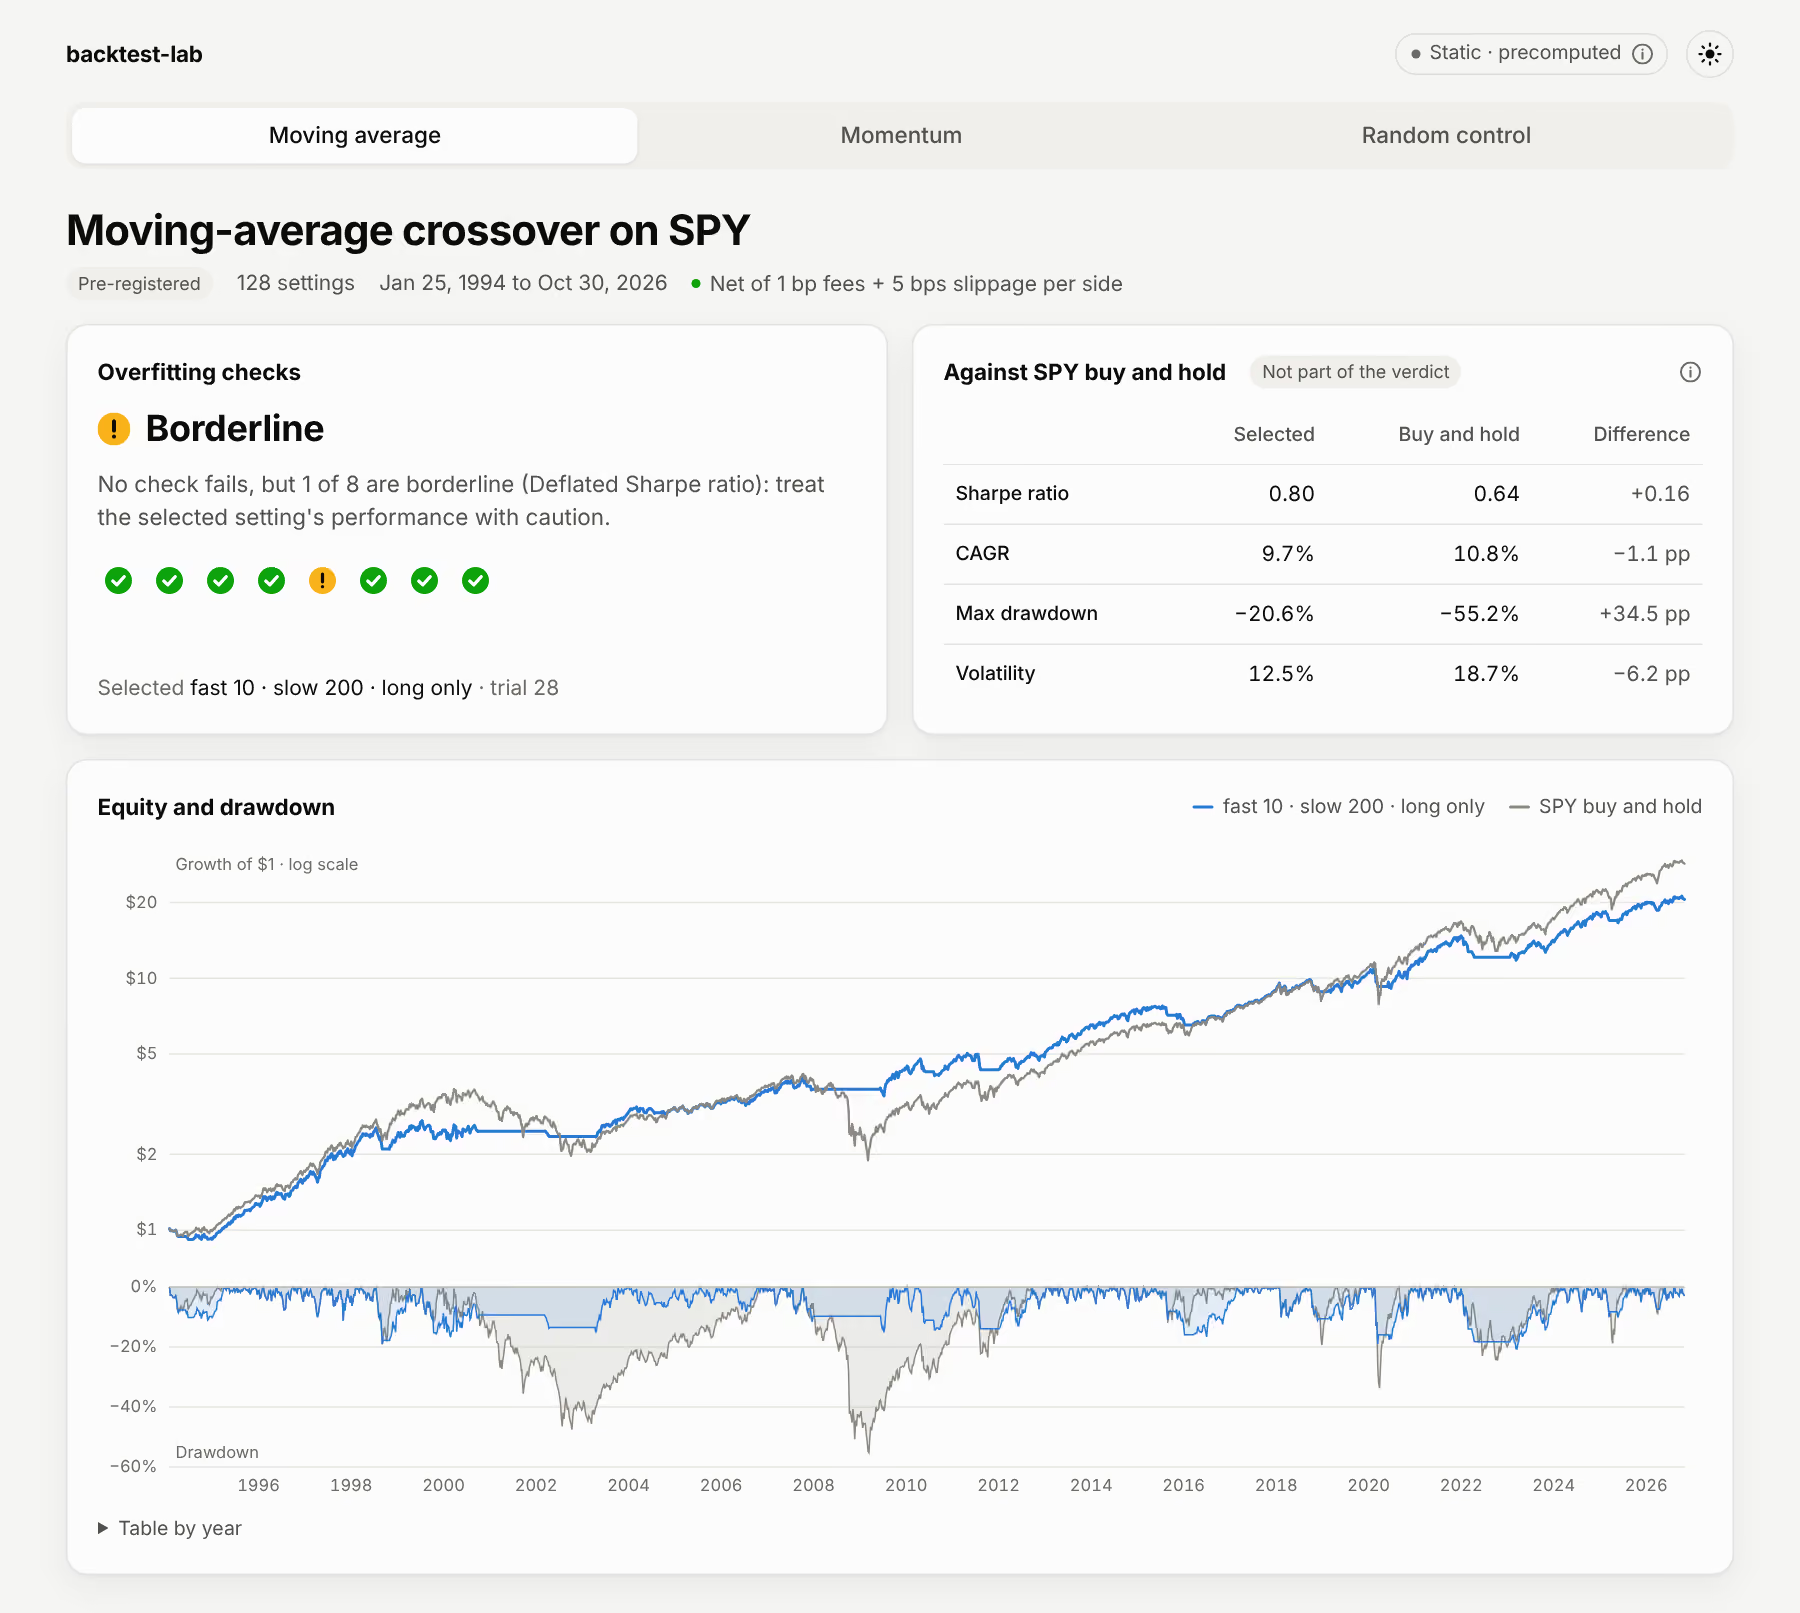
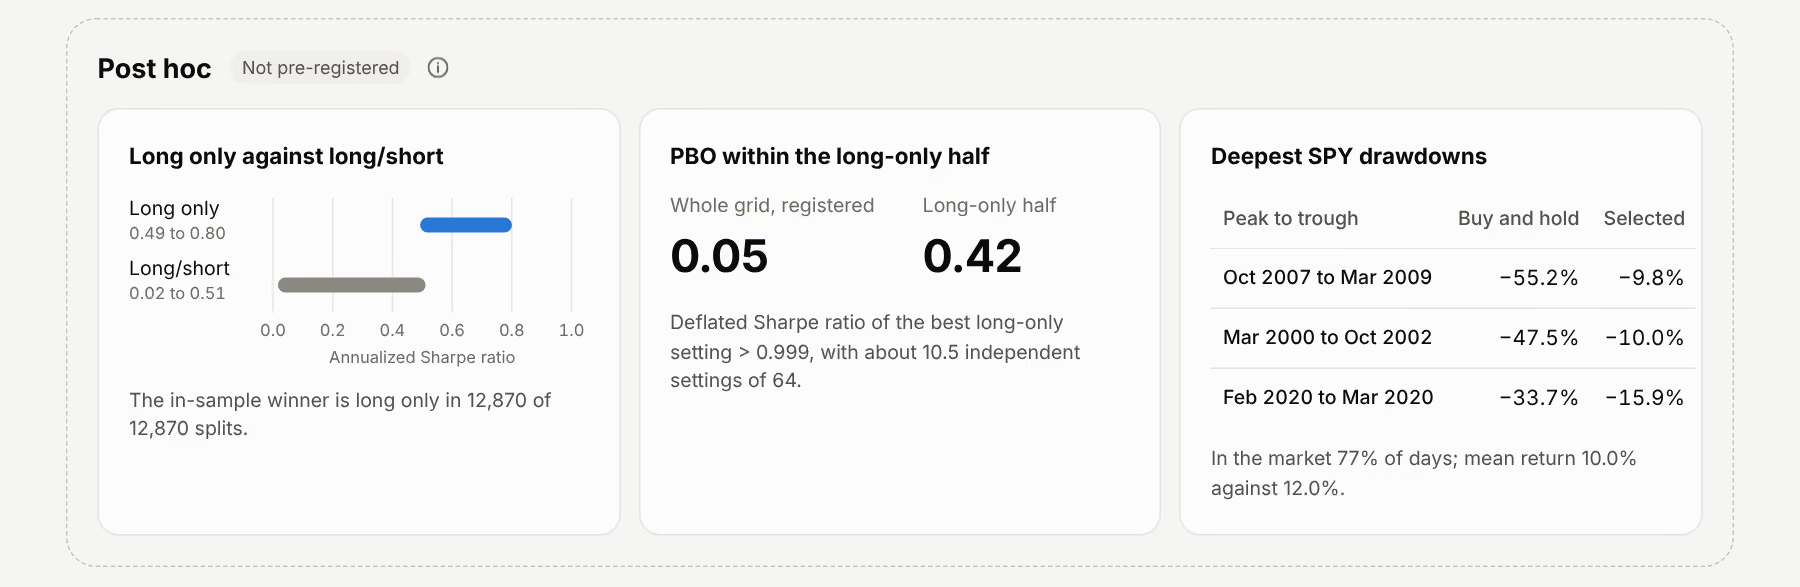
Key metrics
- checks failed by the best of 100 random-signal settings, whose Sharpe ratio is still positive at 0.23
- 6 of 8
- probability of backtest overfitting of the moving-average search, over the whole grid and within its long-only half (post hoc)
- 0.05 → 0.42
- of 200 simulated searches with no skill above the PBO red line of 0.30, set before any real data was used
- 89.5%
- Sharpe ratio of the selected moving-average setting against SPY buy and hold, owed to lower volatility: 12.5% against 18.7%
- 0.80 / 0.64
Three searches on SPY from January 1993 to October 2026, fixed before any strategy was run on real data, with returns net of 1 bp fees and 5 bps slippage per side; each report's sample starts once every setting in its grid has a signal, in January 1994 for the moving-average search. Post hoc figures are labelled as such and carry no confirmatory weight. Demo results
Problem and goals
A parameter search always finds a winner, even among settings with no skill. backtest-lab runs the search, records every trial, and then asks whether the winner is probably overfit, with walk-forward analysis, purged cross-validation, the probability of backtest overfitting (PBO) and the deflated Sharpe ratio, among eight checks. Each check gets a red, yellow or green verdict and one plain sentence, in a credibility report the dashboard renders.
The specification asked for daily prices from yfinance and macro data from FRED, stored as Parquet and queried with DuckDB, with quality checks and a weekly update in GitHub Actions; a daily, multi-asset engine with long and short positions, trading costs and slippage; a grid search that keeps every trial, which multiple-testing corrections need; and a React dashboard. The formulas went into a methods document before any of them was implemented.
The demo trades SPY only; the individual stocks in the data were chosen because they exist today, which is survivorship bias. Cash earns nothing and shorts pay no borrow fee, and macro data is the latest revised vintage. The momentum search is a simplified time-series momentum, without the volatility scaling, excess returns and monthly rebalancing of the original. Passing the checks says the selected Sharpe ratio is above zero and unlikely to be a product of the search alone. The checks do not test timing ability, and no check tests whether a result beats buy and hold: each report shows that comparison as descriptive figures, outside the verdict.
Architecture
A weekly GitHub Actions workflow fetches prices from yfinance and macro series from FRED, runs the quality checks and keeps the data as Parquet, queried with DuckDB; raw data is never committed. The engine turns each setting of a grid into daily returns, filled at the next open and net of costs, and the validation package runs the grid search and the eight checks on the stored trials and writes a credibility report. The three registered reports were produced once and are frozen, checked against their SHA-256 sums in CI. The React dashboard on GitHub Pages reads only the committed reports. Run locally, it can also send a custom sweep to a FastAPI service bound to 127.0.0.1, which runs the same engine and validation and returns a report in the same format.
Key decisions
-
D021 A demo registered in advance
The three demo searches were fixed before any strategy ran on real data: SPY from January 1993 to October 2026 at default costs, a moving-average crossover over 128 settings, time-series momentum over 34, and a random-signal control over 100 seeds, with every check's settings fixed as well. SPY buy and hold is reported beside each winner but takes no part in any verdict: with a zero risk-free rate and the equity premium, a long-biased strategy can look significant just by holding the market. The configuration was not changed after the results were seen.
-
D022 Thresholds set from the null
The verdict thresholds were fixed before any real-data run, so they could not be fitted to the demo. The red line for PBO came from searches with no skill: over 200 simulated ones, PBO averaged 0.488 and 89.5% were above 0.30, so such a search is red about nine times in ten. Green, up to 0.10, follows the paper's remark on investors sensitive to a PBO below 1/10. The overall verdict is the worst of the eight. A later rule withholds a green or yellow PBO or deflated Sharpe ratio when fewer than 10 trials are effectively independent; it was adopted after the registered results were seen, and the registered reports keep their verdicts.
-
D013 Fills at the next open
Target weights are decided at the close of day t and traded at the open of t+1. The day's return compounds the overnight gap, earned by the previous positions, with the open-to-close return of the new ones, and costs are taken at the open between the two. A signal never fills before t+1, which matches the one-day information interval the purged cross-validation assumes. Opens take the same day's dividend adjustment as the close, and since back-adjustment rescales all earlier prices by one constant, signals must be scale-invariant functions of prices to stay free of look-ahead.
-
D029 Post hoc analyses kept apart
The demo's conclusions come from the registered results alone. Analyses chosen after seeing them, such as the long-only half of each grid, the in-sample winners of the cross-validation splits and the comparison with buy and hold in its deepest drawdowns, live in their own module and results directory and are labelled post hoc wherever they appear. Choosing which subset to show after seeing the results is itself a selection, the effect the project measures.
-
D030 Charts on d3-scale and d3-shape
The dashboard's four chart forms are small React components that draw SVG with d3-scale and d3-shape, coloured with CSS variables so both themes come from one stylesheet. Measured as the gzipped size of a minimal line chart: ECharts 6 with tree-shaken imports 176 kB, Recharts 3 71 kB, visx 45 kB, uPlot 23 kB with no heat map, and d3-scale with d3-shape 16 kB. Every chart can be focused from the keyboard, gives a spoken readout and has a data table beside it.
Challenges
-
A sweep that sat flat without an error
Sweeps through the API kept the benchmark's dates as well as the traded ticker's. A bar missing from the traded ticker then became a row of NaN, and each rolling indicator stayed NaN for a full window after it, so the strategy sat flat for up to
sloworlookbackdays without an error, and the sweep disagreed with a single backtest of the same parameters. A sweep now runs on the dates where a traded ticker has a price; the benchmark is a column on those dates, and one missing a bar there fails the sweep with the engine's message. The registered demo trades and benchmarks SPY only, so it was unaffected. -
Stale opens in the price data
Of 8,497 SPY bars from 1993 to October 2026, 159 have an open equal to the previous close. In 2016 and 2017, 21.7% of these also equal the day's high or low, against 0.4% of other days, which points to stale data; a stale open turns a fill at the next open into a fill at the close that formed the signal. The data checks now warn about such bars without changing them. Replacing the 159 opens with draws from each year's overnight volatility over 30 seeds, or with the day's low or high, left every moving-average and momentum verdict unchanged, and the control stayed red overall in every variant.
-
Two definitions of PBO
The code counts a split as overfit when its logit is at most 0, the estimator of Bailey et al. (2017, Section 3.1), while their Definition 2.2 counts only ranks below N/2. For an even number of settings N the two also differ at rank N/2, which the estimator counts; the methods document had said they differ only at a logit of 0, which holds for an odd number only. Under Definition 2.2 the registered searches give 585, 1,393 and 3,748 overfit splits of 12,870 instead of 607, 1,590 and 3,853, a PBO of 0.045, 0.108 and 0.291, with every verdict the same, so the registered reports keep the estimator.